Which SaaS Categories AI Actually Recommends (13 Categories, Measured)
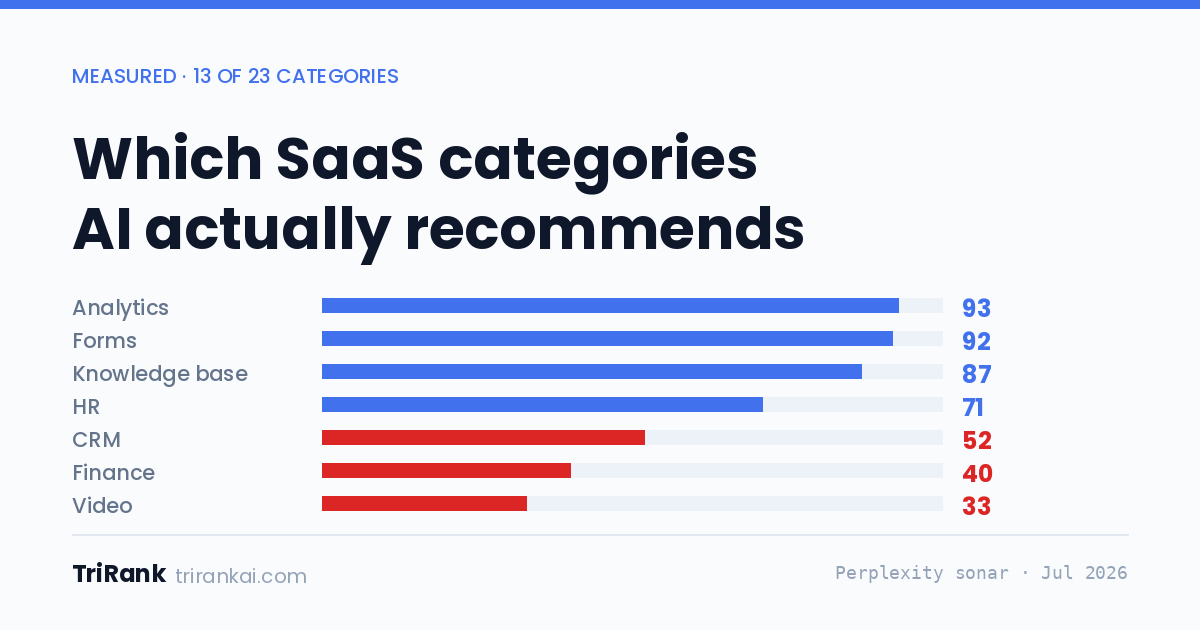
Analytics tools score 93 out of 100 on AI visibility. Video tools score 33. We measured 13 SaaS categories on the same three questions in July 2026.
The same engine, the same three questions, the same month — and a SaaS analytics tool is nearly three times as likely to get cited as a video tool.
That is the shape of the data we found when we cut our AI visibility benchmark by category. It is the least-discussed part of the dataset and probably the most actionable, because it tells you what kind of problem you have before you spend anything trying to fix it.
What was measured
101 well-known SaaS brands, sorted into categories, each asked three questions on Perplexity (sonar) in July 2026:
- a question about the brand by name
- a question about reviews of the brand
- a question about alternatives in its category
A brand counts as cited when its own domain appears in the engine's structured citation list. The AI visibility score below is the share of those three prompts on which brands in the category were cited, averaged and expressed out of 100. The sample-wide average was 67.6.
The table
| Category | Brands | AI visibility score | Cited on brand query | Cited on alternatives |
|---|---|---|---|---|
| Analytics | 5 | 93 | 100% | 80% |
| Forms | 4 | 92 | 100% | 75% |
| Knowledge base | 5 | 87 | 100% | 80% |
| Monitoring | 5 | 87 | 100% | 80% |
| Dev platform | 4 | 75 | 100% | 50% |
| HR | 9 | 71 | 89% | 56% |
| Project management | 9 | 63 | 89% | 67% |
| Design | 6 | 56 | 100% | 50% |
| Productivity | 6 | 55 | 100% | 33% |
| CRM | 9 | 52 | 67% | 56% |
| Automation | 4 | 42 | 100% | 25% |
| Finance | 5 | 40 | 60% | 20% |
| Video | 5 | 33 | 80% | 0% |
Two limits before you read anything into it. This is 13 of 23 categories — the other ten had fewer than four brands sampled and were held back rather than published thin. And the smallest rows here have four brands. A four-brand average is a prompt to go look, not an industry conclusion.
The three patterns worth naming
1. The gap is almost entirely in the alternatives column
Look at the "brand query" column: eight of thirteen categories sit at 100%. The engine knows these products. What separates a 93 from a 42 is almost entirely what happens on the third question — the one a buyer actually asks.
Automation is the cleanest example. Every brand cited on its own name; a quarter cited when someone asks for alternatives. Productivity: 100% and 33%. Design: 100% and 50%. The knowledge is there and it does not convert.
2. Categories where buyers argue in public score highest
Analytics, monitoring, knowledge base and forms all sit at 80% on alternatives. These are categories with dense third-party footprints — long-running community threads, comparison writeups, review pages that people actually maintain.
That matches what the engine is citing. Across the whole run, Reddit accounted for 9.1% of all citations and appeared for 98 of 101 brands; G2 took 3.9% across 73 brands. Brands' own domains took 10.2% of the total. The engine is assembling its answer out of what other people wrote at least as much as what you wrote.
Google's documentation on AI features describes the same thing from the other side: what gets surfaced is what the engine can retrieve and attribute at answer time.
3. Two categories are anomalies worth staring at
CRM is the only category where brand-name recognition itself is low — 67%, against 100% for eight others. Nine brands sampled, so it is not a tiny-sample artifact. Something about how CRM products are written about makes them harder to attribute even when asked directly.
Video is the sharp one: 80% on brand queries, 0% on alternatives. Five brands, not one of them cited when the engine was asked to recommend options in the category. Given that YouTube is the second-largest citation source in the whole dataset at 8.0%, this is a category where the dominant venue is video itself — and the engine appears to be reaching for it without reaching for the vendors.
What to do with your own category's number
If your category scores high, the ceiling is competitive rather than structural. Everyone in it is being cited; the question is share. That is a share-of-voice problem, and the metrics are in AI search visibility metrics and KPIs.
If your category scores low, the material does not exist yet — and that is a cheaper problem than it looks. In a category where nobody is being cited on alternatives, the first brand that gets properly represented in comparison and community content has an open field. The playbook is in how to get cited by ChatGPT, and the case for measuring before spending is in why use AI search monitoring tools.
Either way, check your own brand rather than trusting the category. These are averages over four to nine brands; individual products inside a category vary more than the categories vary from each other. How to improve brand visibility in AI search covers the work, AI SEO statistics covers the wider context, and AI SEO tools for small business covers doing it without a team.
We also publish per-industry guides for several of these: finance and fintech tools maps to the finance row above (score 40), and HR tools maps to the HR row (score 71).
For terminology: AI search visibility, AI citations, LLM visibility.
Boundaries
One engine (Perplexity sonar), one month (July 2026), 101 brands, three prompts each. Thirteen categories shown of 23, threshold four brands. Category averages with n as low as four. "Cited" means the domain appeared in the structured citation list, not that the brand was mentioned in prose.
Every figure above traces to the benchmark page, which carries the same dates and the same thresholds.
FAQ
Why only 13 categories when the sample has 23? Categories with fewer than four brands sampled are aggregated away rather than published. Ten of the 23 fell below that threshold. They are not missing from the world, they are held back from the table because four brands is already a thin basis for a category average.
What does an AI visibility score of 93 mean? It is the share of the three prompts on which brands in that category were cited, averaged across the category and expressed out of 100. Analytics scored 93; video scored 33. The sample average across all 101 brands was 67.6.
Does a low category score mean my product is invisible? No. Category averages describe where the engine is finding material, not individual products. The useful reading is directional: in low-scoring categories, comparison and community content is thinner, so an individual brand has more room to become the thing that gets cited.
Author

Categories
More Posts
Why Ranking #1 on Google Doesn't Get You Cited by AI (833 Keywords, 831 Never Checked)
A site we own ranked on page one for 833 Google keywords as of 2026-08-12 — and 831 of them had never been checked against a single AI engine. Why Google rankings don't transfer to AI answers, and why 'not cited' and 'not checked' are different findings.
AI SEO Statistics (2026)
The AI SEO statistics that matter in 2026: market size, conversion, citation mechanics, zero-click, and the monitoring gap, each with its source.
The True Cost of Manual SEO (and What Automation Saves)
The true cost of manual SEO is time, agency fees, and lost compounding. See the breakdown, a cost comparison table, and where automation pays off.
Newsletter
Join the community
Subscribe to our newsletter for the latest news and updates